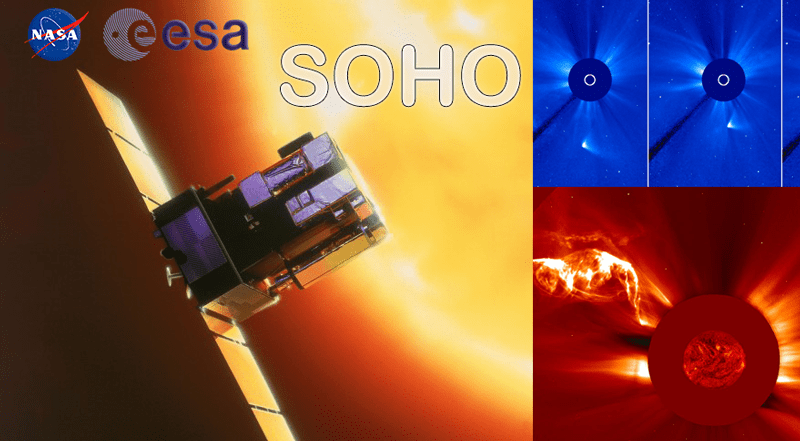

SOHO – Solar and Heliospheric Observatory

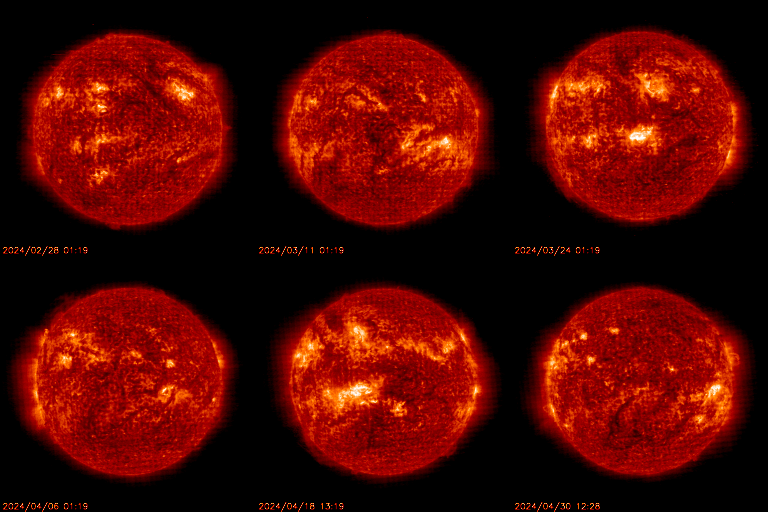 EIT 304 |
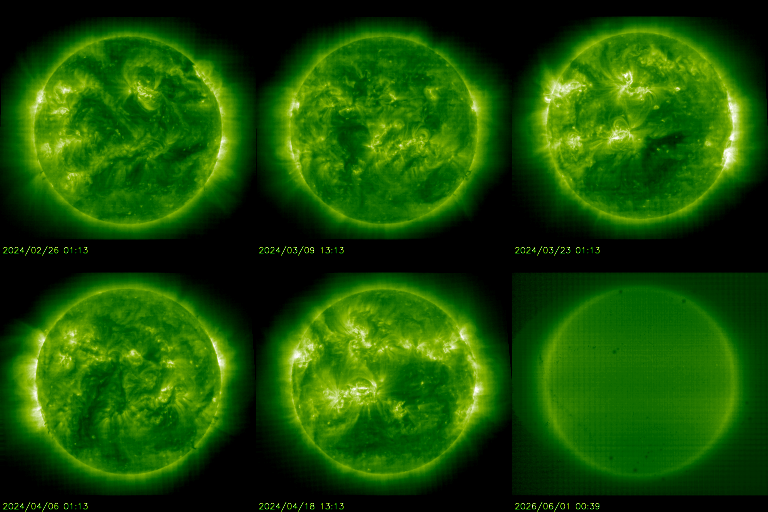 EIT 195 |
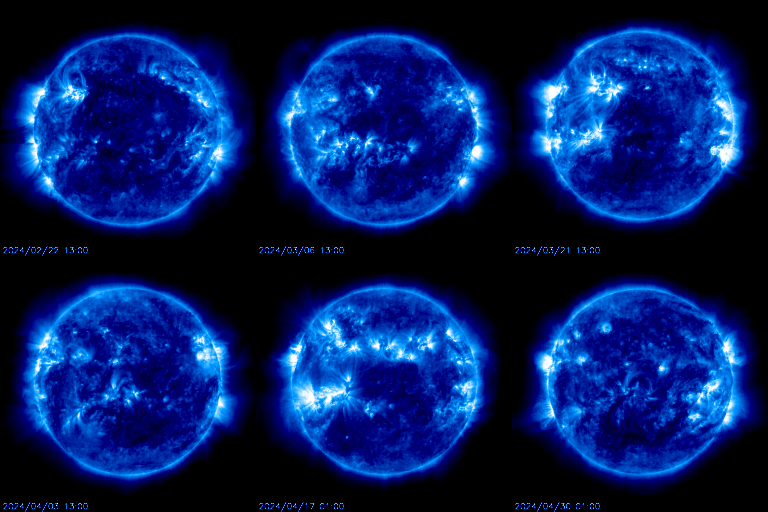 EIT 171 |
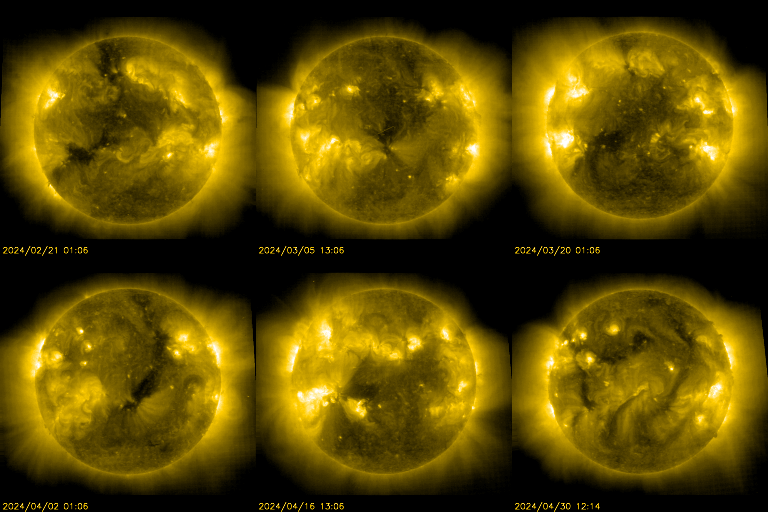 EIT 284 |
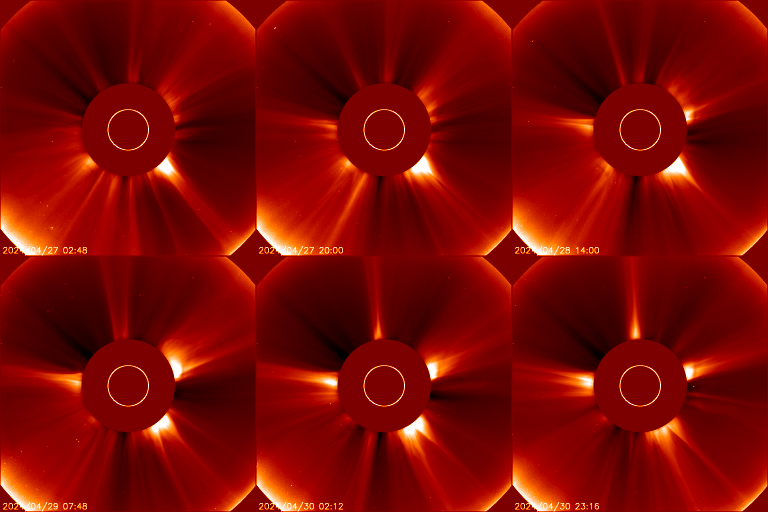 LASCO C2 |
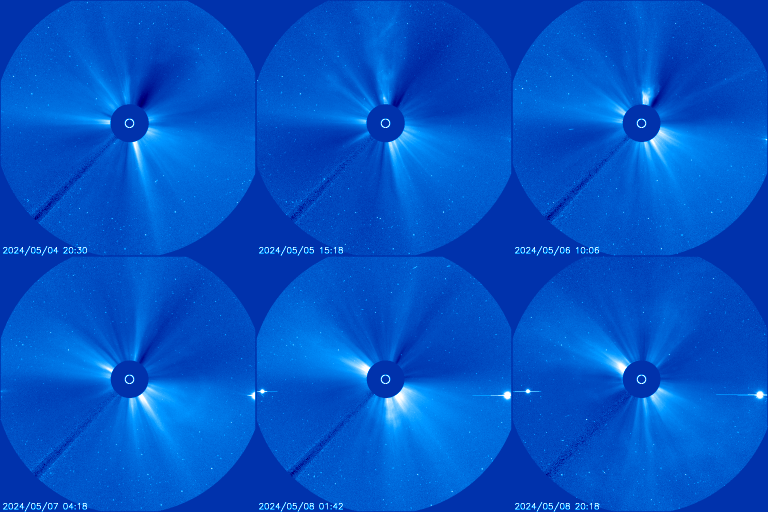 LASCO C3 |
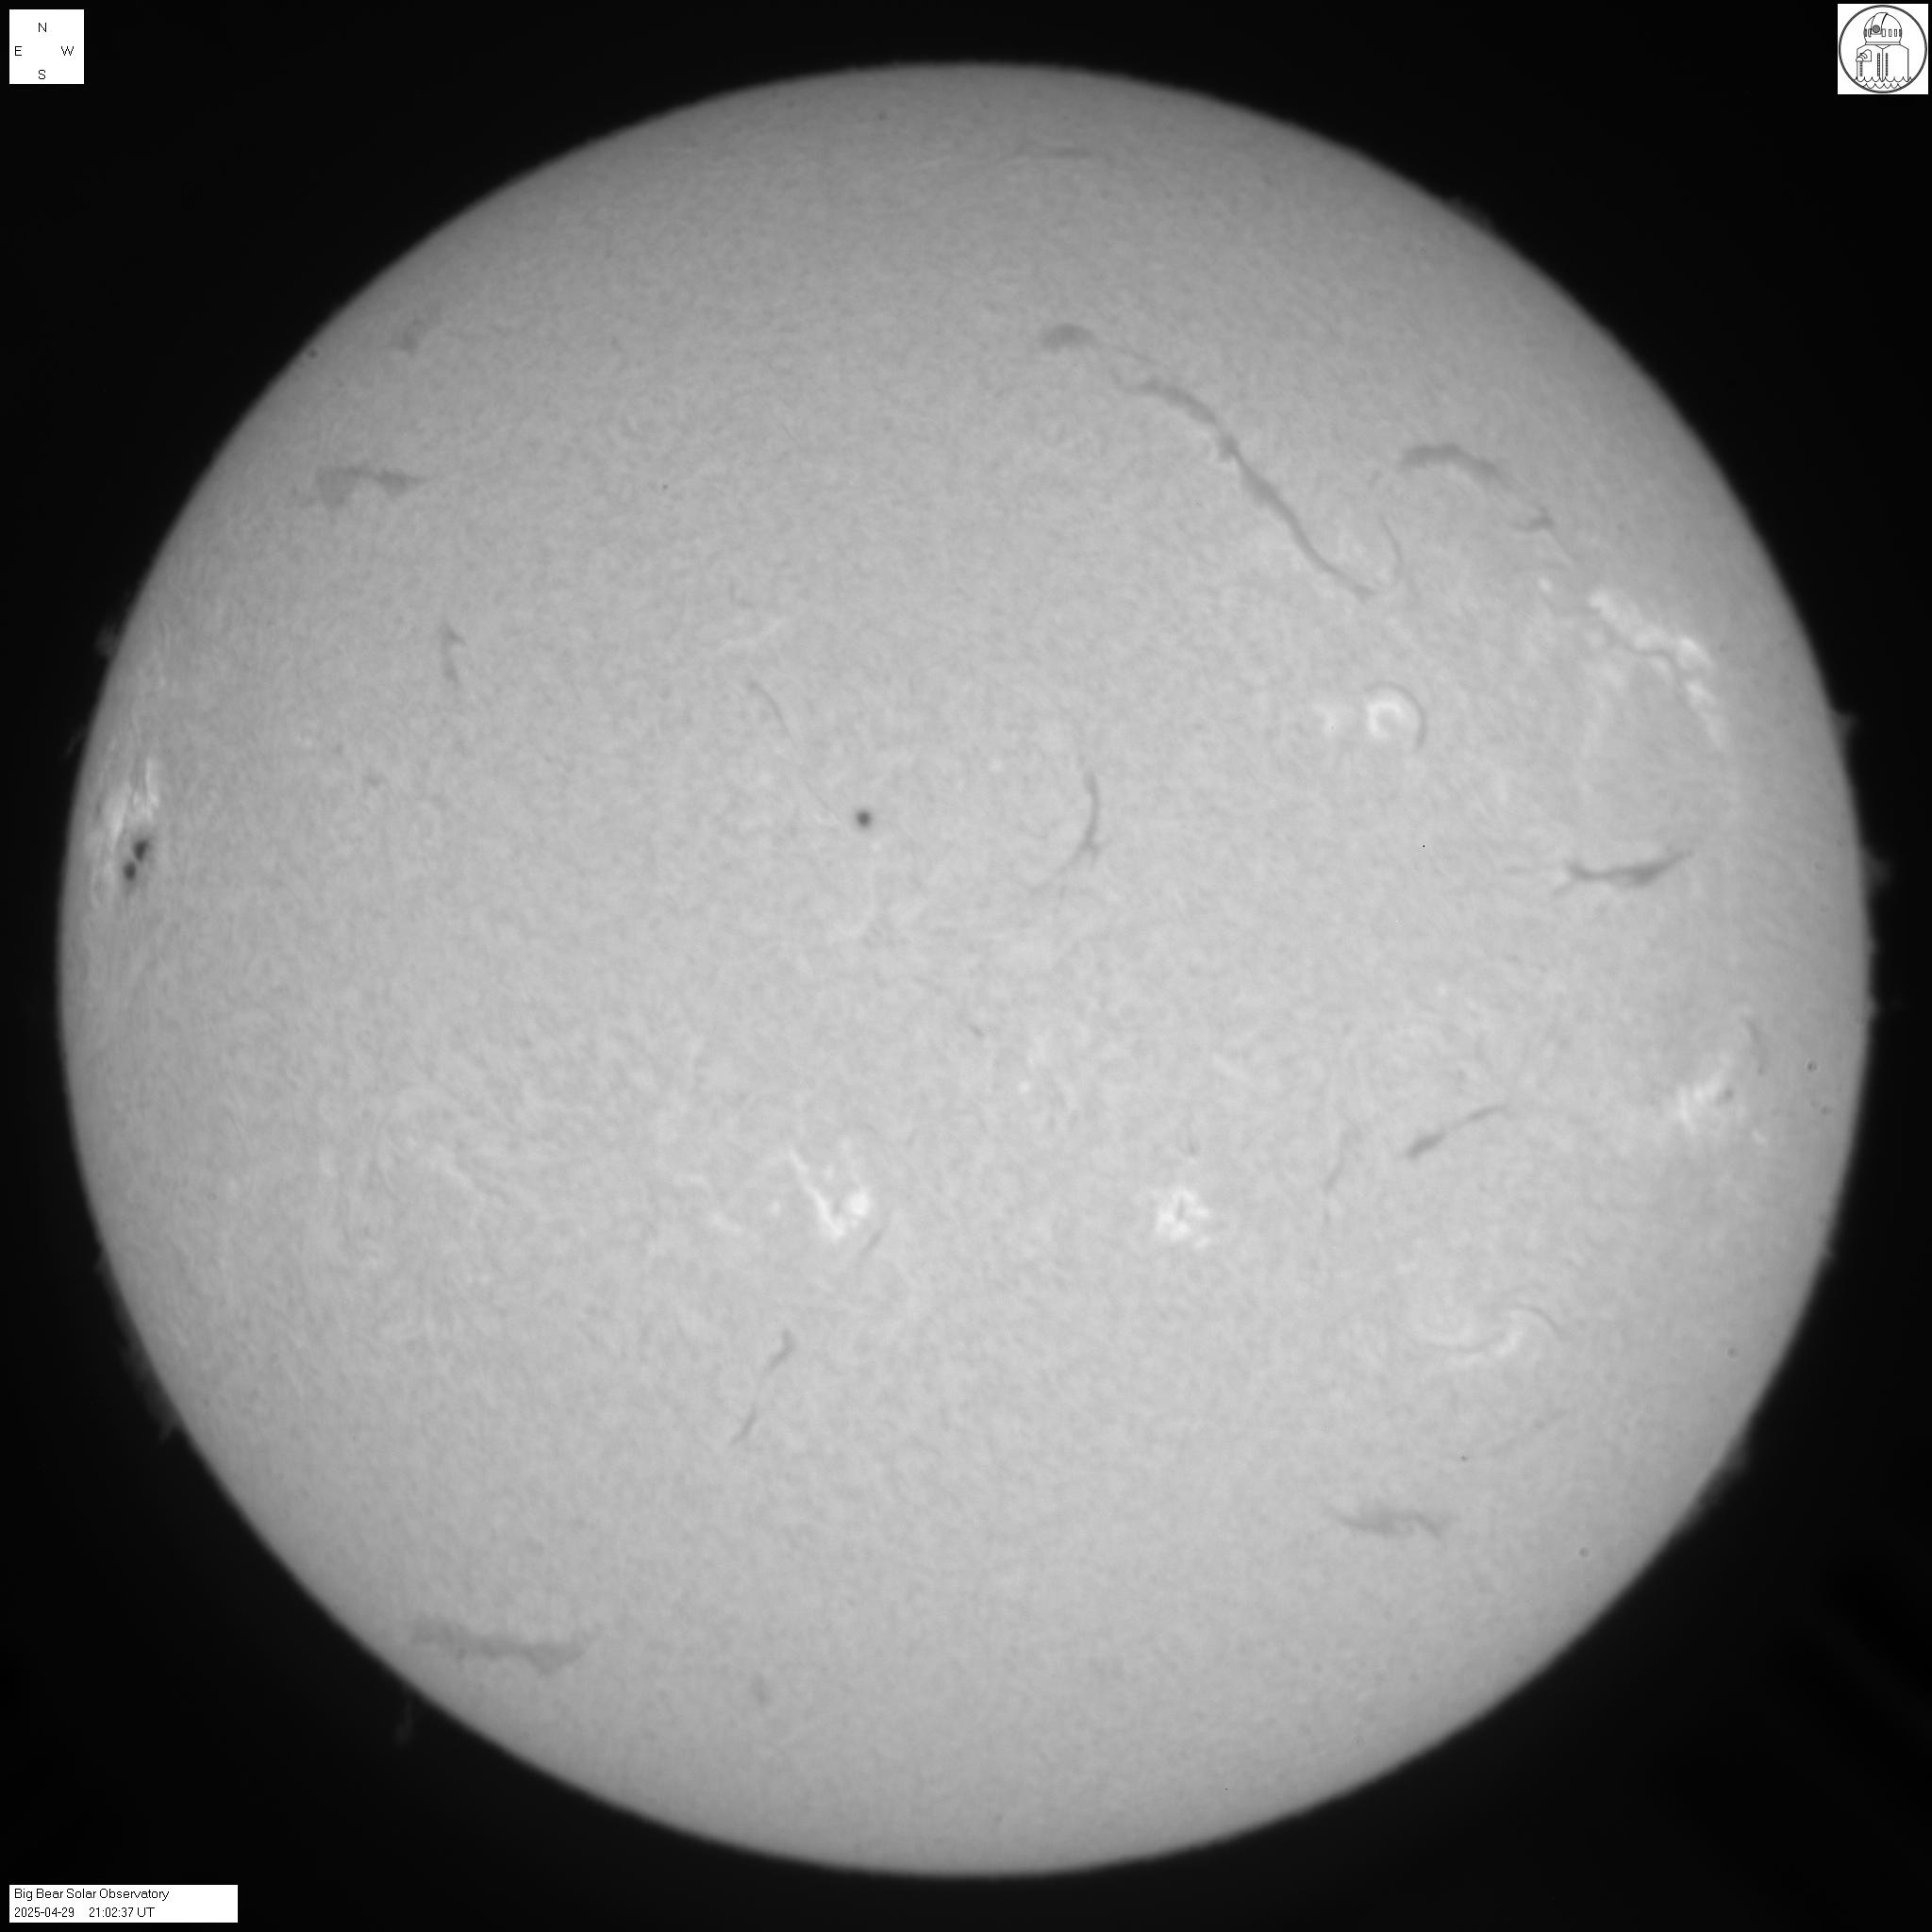 H-Alpha |
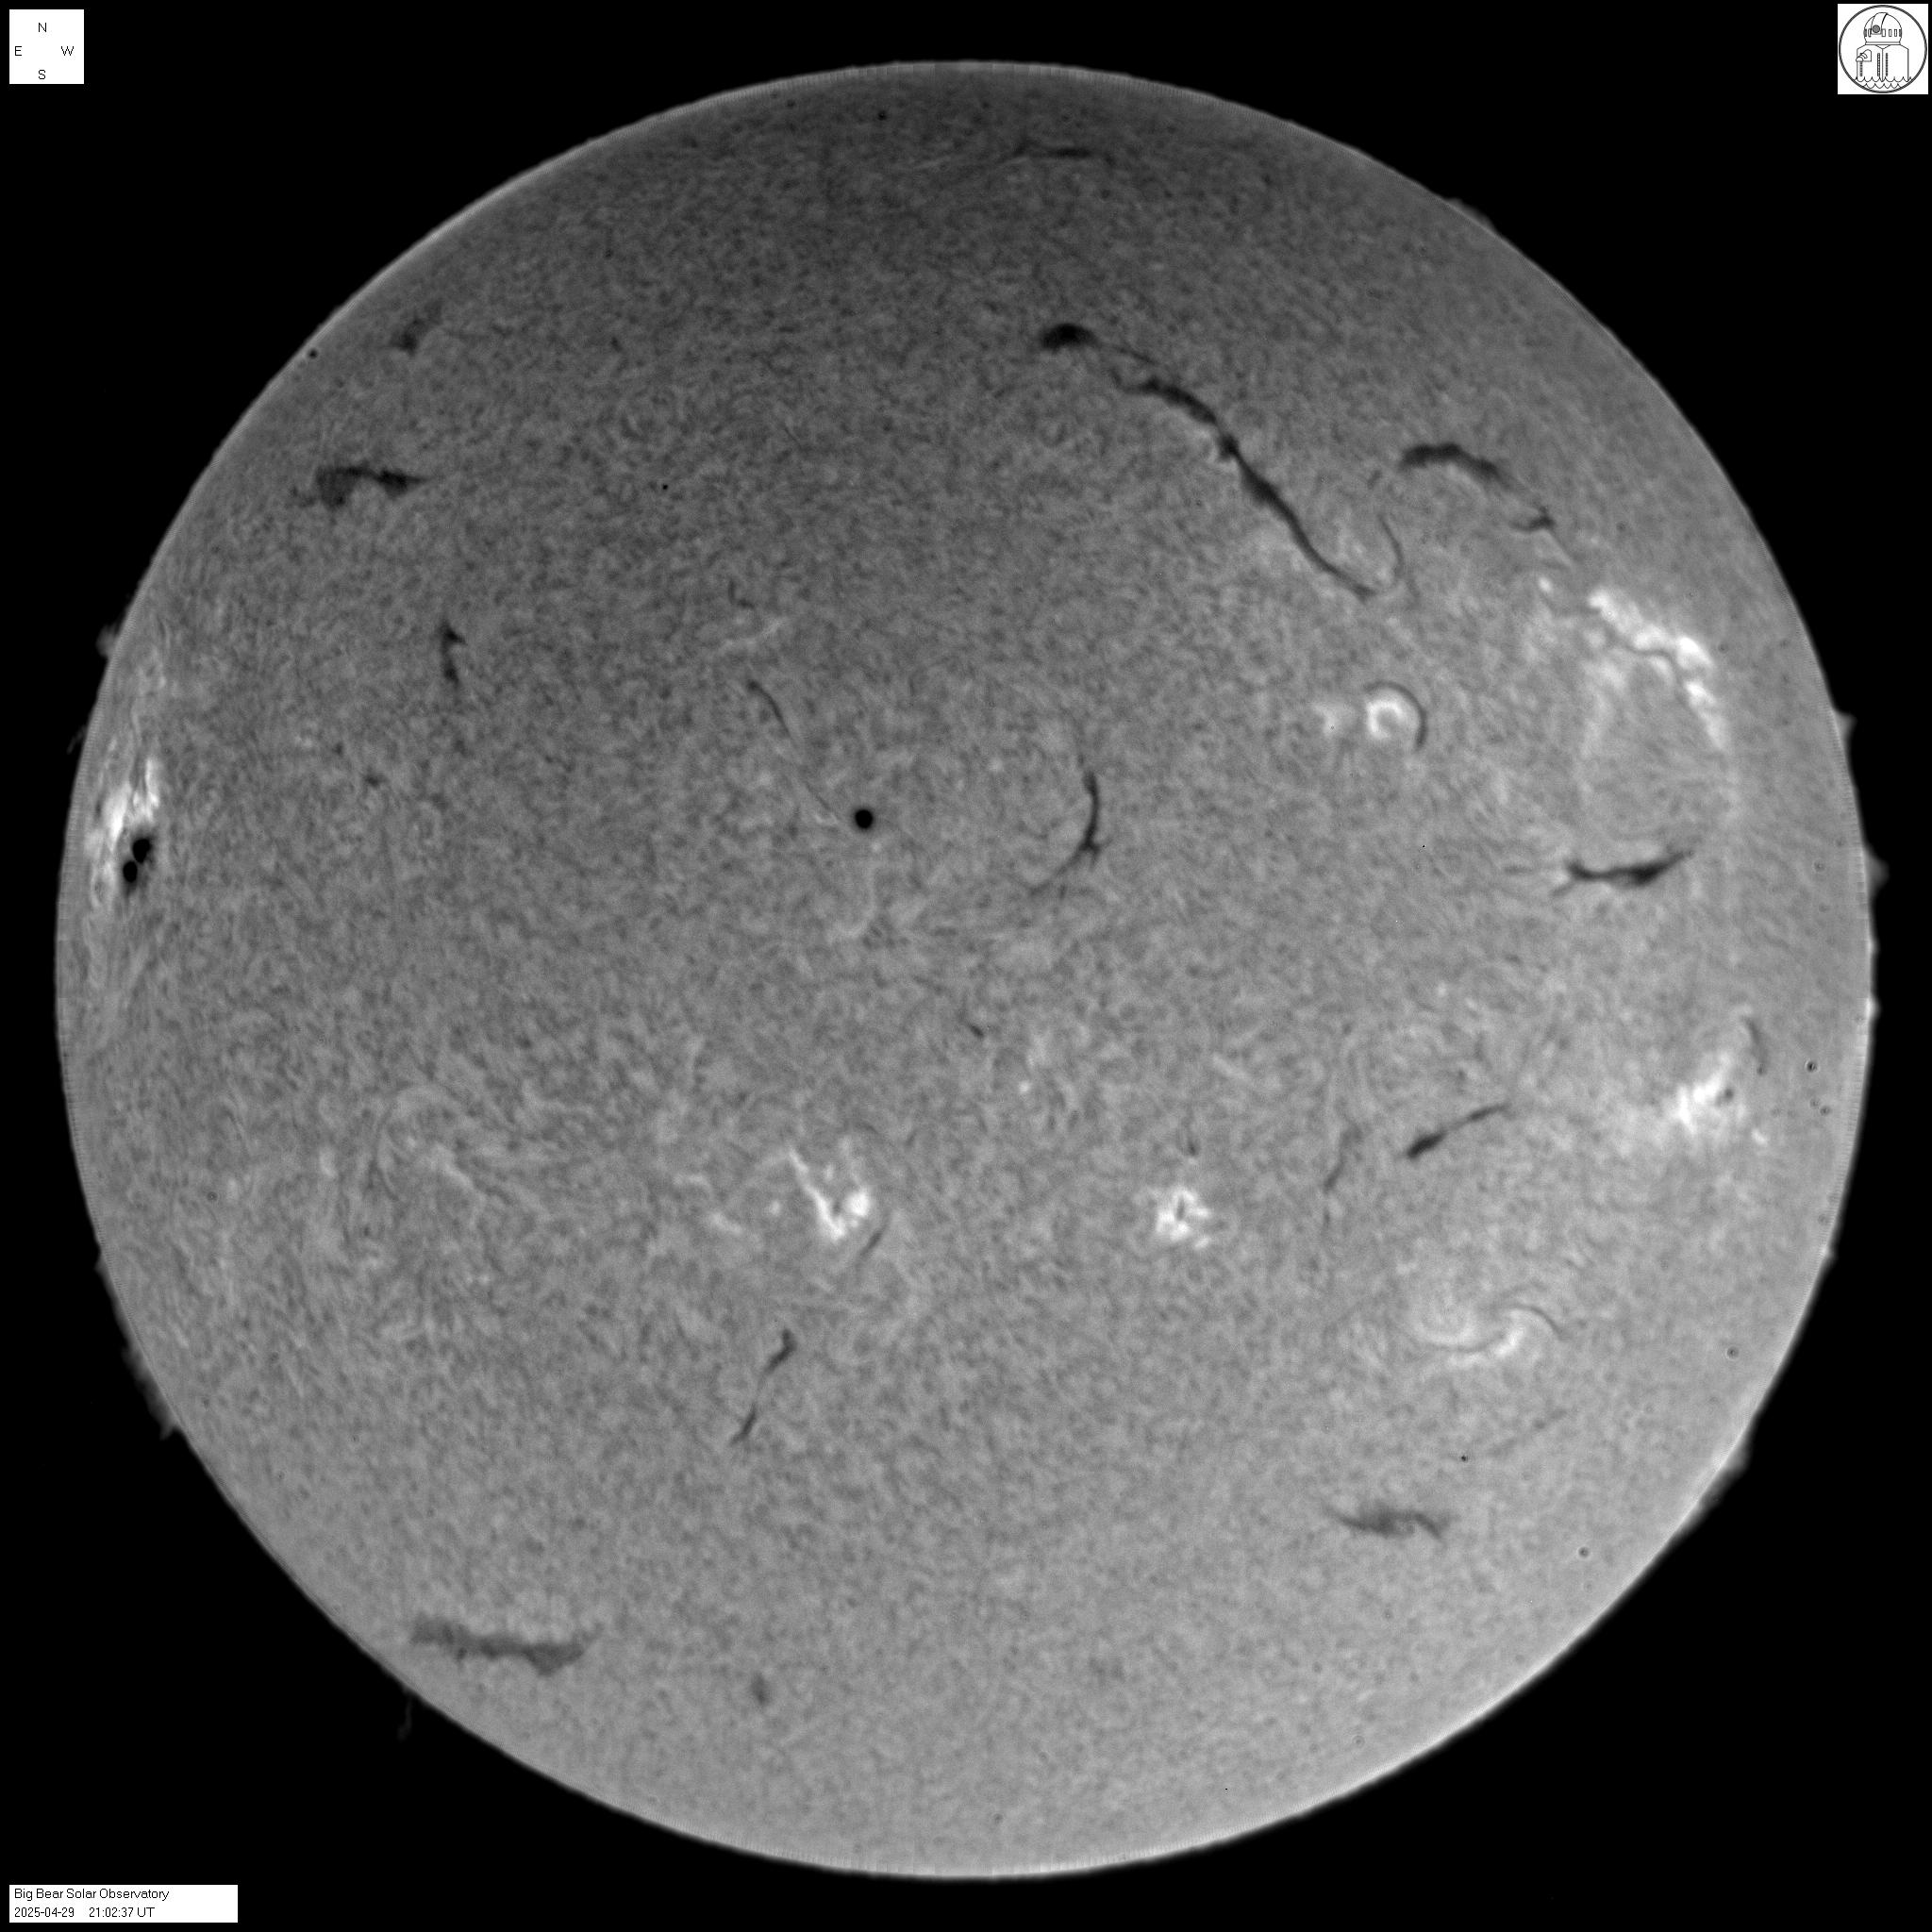 H-Alpha Contrasted |
 Nobeyama 17 GHz |
|
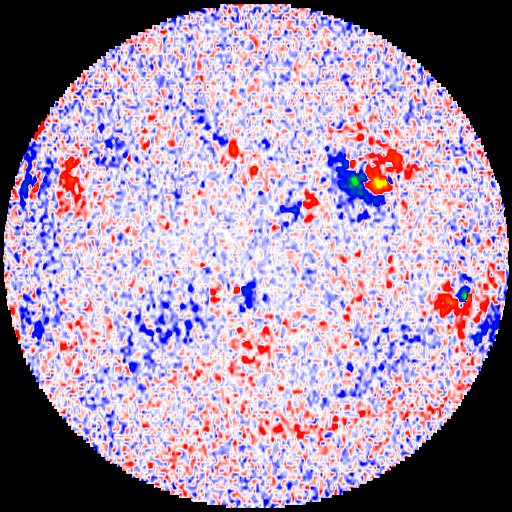  Magnetogram 525.02nm (Fe I) |
| Solar X-rays |  |
| Geomagnetic Field |  |
X-Ray flux |
Electron flux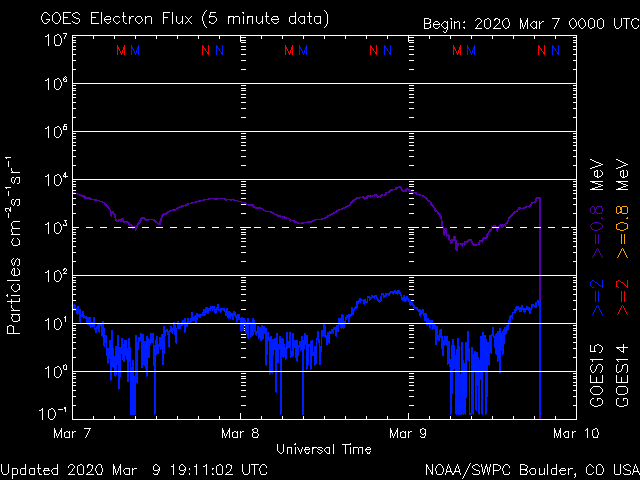 |
Proton flux |
Magnetometer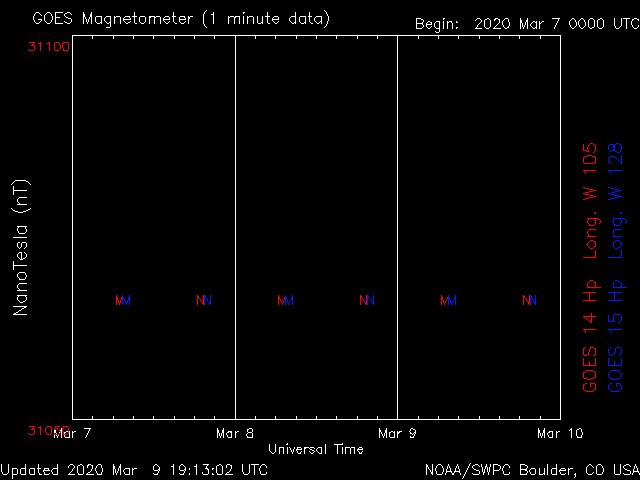 |
Satellite Environment |
SOLAR WIND
Total Electron Content (TEC) |
| Latest 48h of photon data |
 |
 |
Solar Wind Speed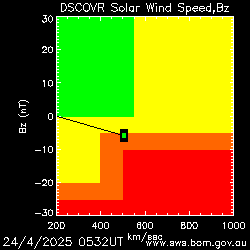 Solar Wind Velocity  Density  Primary Solar X-Rays  |
About the Solar X-ray status monitor
The X-ray Solar status monitor downloads data periodically from the NOAA Space Environment Center FTP server. The previous 24 hours of 5 minute Long-wavelength X-ray data from each satellite (GOES 8 and GOES 10) is analyzed, and an appropriate level of activity for the past 24 hours is assigned as follows:
| Normal: Solar X-ray flux is quiet (< 1.00e-6 W/m^2) | |
| Active: Solar X-ray flux is active (>= 1.00e-6 W/m^2) | |
| M Class Flare: An M Class flare has occurred (X-ray flux >= 1.00e-5 W/m^2) | |
| X Class Flare: An X Class flare has occurred (X-ray flux >= 1.00e-4 W/m^2) | |
| Mega Flare: An unprecedented X-ray event has occurred (X-ray flux >= 1.00e-3 W/m^2) The designation “Mega Flare” was chosen by Kevin Loch when the status monitor was created on March 4, 1999. There is no “official” designation for flares in this range. |
About the Geomagnetic Field status monitor
The Geomagnetic Field status monitor downloads data periodically from the NOAA Space Environment Center FTP server. The previous 24 hours of 3 hour Planetary Kp Index data is analyzed and an appropriate level of activity for the past 24 hours is assigned as follows:
| Quiet: the Geomagnetic Field is quiet (Kp < 4) | |
| Active: the Geomagnetic Field has been unsettled (Kp=4) | |
| Storm: A Geomagnetic Storm has occurred (Kp>4) |
LINKS
– The full Current Solar Data page
– Glossary and Information about these plots (noaa web site)
DATA SOURCES
– n3kl.org
– umtof.umd.edu
– spacew.com
– sws.bom.gov.au
– swpc.noaa.gov
Some information about SOHO
Courtesy of the SOHO/EIT and SOHO/LASCO consortium.
The Solar and Heliospheric Observatory (often abbreviated to SOHO) is a space telescope launched in late 1995 to study the Sun. It is a joint project of the European Space Agency (ESA) and NASA.
SOHO simultaneously studies many aspects of the Sun, from the structure and dynamics of its interior to the solar wind. Great attention has been paid to the attempt to solve the biggest problem of solar physics, which concerns the temperature of the corona, the outermost layer of the atmosphere. This has in fact a temperature of over 1 million kelvin, compared to less than 6000 of the surface below. For now, a convincing solution has not yet been found, but SOHO has identified some magnetic energy transmission channels from just below the surface to the corona.
Precisely because of the desire to study many aspects of the Sun, the probe carries as many as 12 different scientific instruments, each of which can observe the Sun or parts of it independently. The instruments are:
- Global Oscillations at Low Frequencies (GOLF) measures the speed and variation of the solar disk to analyze the solar core.
- Variability of Solar Irradiance (VIRGO) measures solar disk oscillations and low resolution analyzes the core.
- Michelson Doppler Imager (MDI) measures the speed of the magnetic field of the photosphere to better understand the convective zones that form the inner layers of the Sun and control the structure of the corona.
- Solar UV Measurement of Emitted radiation (SUMER) measures temperature and density of corona plasma fluxes.
- Coronial Diagnostic Spectrometer (CDS) measures temperature and density of corona plasma streams.
- Extreme UV Imaging Telescope (EIT) studies the low corona, its structure and activity.
- UV Coronagraph and Spectrometer (UVCS) measures density and temperature of the corona.
- Large Angle Spectrometer Coronagraph (LASCO) studies the structures and evolution of the crown.
- Solar Wind Anisotropies (SWAN) uses a telescope sensitive to different wavelengths of hydrogen to measure the outgoing solar flow with the solar wind. It is also used to map the heliosphere and to observe the large-scale structures of the solar wind.
- Charge, Element, Isotope Analysis (CELIAS) studies the ionic composition of the solar wind.
- Suprathermal & Energetic Particle Analyser (COSTEP) studies the composition of ions and electrons of the solar wind.
- Energetic Particle Analyser (ERNE) studies the composition of ions and electrons of the solar wind.
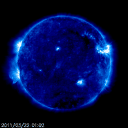 EIT 171 |
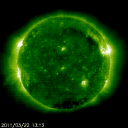 EIT 195 |
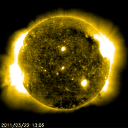 EIT 284 |
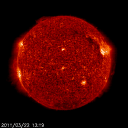 EIT 304 |
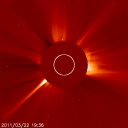 LASCO C2 |
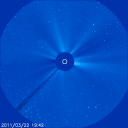 LASCO C3 |
The EIT is the SOHO tool that has produced the most spectacular results. It is able to capture detailed images of the entire solar surface in ultraviolet light; in this way, it is easy to detect bumps and flares, highly energetic phenomena that affect the entire solar atmosphere.
The images show the Sun at different temperatures, the higher the temperature the more we can see in the Sun’s atmosphere.
The LASCO is a degree of capturing images of the solar corona thanks to a disc that creates an artificial eclipse, whose position is highlighted in the images with a white circle. The shadow in the lower left corner is the support for the central disk.
The LASCO is mainly dedicated to the study of the Sun’s corona and the solar wind. Occasionally it is possible to observe mass ejections from the solar corona, which expand throughout the available field of view. The C2 images show the sun from 8.4 million kilometers, while the C3 images from 45 million kilometers.

